
Blog
The Pipeline Continues to Grow – Especially in Extended Stay
In Q1 2024, the hotel construction pipeline hit an all-time high globally for room count according to Lodging Econometrics. And with total projects standing at over 15,000, that represented a 6% increase year-over-year (YoY). Specifically in the U.S., the pipeline continued to grow as it reached over 6,000 projects – a YoY increase of 9% and new all-time high. Of those projects, there were 1,144 under construction which was also a 9% YoY increase.
And with longer term stays (7 consecutive nights or longer) continuing their upward trajectory, extended stay hotels made up a sizable portion of this pipeline. According to a joint report published by Kalibri Labs and The Highland Group last year, extended stay room revenues from traditional hotels were 21% higher than from purpose-built extended stay hotels, indicating considerably more potential for additional development within this segment. Ned Washburn with RReaf Holdings stated recently that the extended stay market is projected to grow to $25 billion by 2027 – up from $18 billion in 2022. With the popularity and resiliency of this asset class since the COVID-19 pandemic, combined with the positive trend in longer length of stay demand across the U.S., developers continue to favor extended stay projects. In Q1 of this year, brands in this segment accounted for 37% of all projects under construction.
Quantifying Extended Stay Market Opportunity
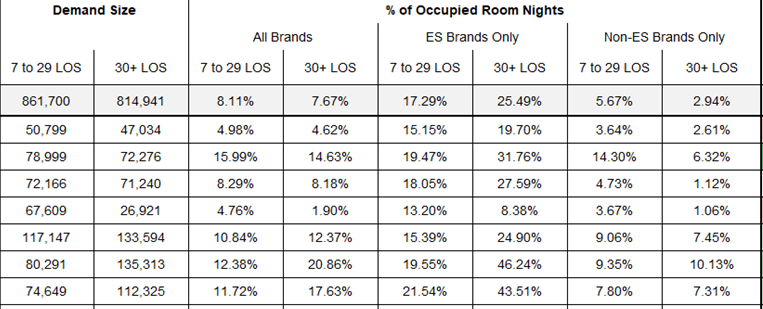
Data analytics have played a significant role in the underwriting and site selection processes for extended stay hotel projects. Historically, stakeholders have only had traditional metrics at their disposal and typically relied upon estimating the extended stay demand in a prospective market or submarket. By evaluating top-line ADR, Occupancy, RevPAR, ALOS (Average Length of Stay), and other basic key performance indicators, developers and investors have been able to gain only limited insights into the performance of any market or submarket. However, as the industry has changed over the past several years, and hoteliers are competing for this ever-growing demand for extended stay business, it is critical for stakeholders to have access to a more granular picture of business mix not provided by traditional metrics. Focusing on those specific length-of-stay segments that define “extended stay” must be a priority. Traditional ALOS tells only one part of the performance story. Underwriting for opportunities for this growing asset type requires analyzing performance by 0-6, 7-14, 15-29, and 30+ length of stay tiers in order to more accurately project extended stay occupancy and repeatable demand patterns.

Furthermore, identifying the demand mix specifically within those 7-29 and 30+ LOS buckets – AND which property types (extended stay or non-extended stay) are accommodating this demand – will provide improved guidance for site selection in any of the 334 markets or 975 submarkets in the U.S.
A More Detailed Approach to Extended Stay Underwriting
The extended stay hotel market is growing, and this upward trajectory is expected to continue into the near future as development deals and investment activity increase along with new brand launches over the past few years (Hyatt Studios, Echo Suites, LivSmart Studios, StudioRes to name a few). Despite recent economic challenges and high interest rates, it is important that decision-makers consider a more detailed approach to considering any potential deal. By further analyzing the TRUE length of stay in any market and which properties are currently winning those longer stays, developers, investors, lenders, brokers, appraisers, and other investment professionals can look beyond traditional metrics to better quantify any new opportunities.